Last updated: October 2026
Key takeaways
- "Recovery rate" names several different calculations, so quoted figures often aren't comparable.
- Klaviyo abandoned cart email flows average $6.77 revenue per recipient and a 6.0% click rate.
- Before comparing to anyone, check the denominator, the attribution window, and the channel.
- Attributed orders aren't the same as orders the flow caused. Holdout testing separates them.
- Compare inside your own industry and price point, not against ecommerce generally.
There's no single benchmark for a good abandoned cart recovery rate, because the phrase covers several different calculations. The closest current reference points come from Klaviyo's October 2026 report, drawn from more than 110,000 brands: abandoned cart email flows average $6.77 in revenue per recipient and a 6.0% click rate, with the top 10% reaching $13.70 and 11.3%. Whether your number looks good depends entirely on which calculation produced it.
Recovery rate and email conversion rate measure different metrics
Recovery rate and email conversion rate answer different questions. Shopify's guide defines abandoned cart recovery rate as recovered carts divided by total abandoned carts, multiplied by 100. Klaviyo's conversion rate describes attributed orders as a share of the people who received the message. Neither is wrong; the two numbers just can't be compared.
Before comparing your result to anyone else's, check three things: which abandoned carts are in the denominator, which recipients are counted, and what attribution window produced the orders. Two brands can run comparable flows and report very different numbers on all three.
Three calculations produce three different answers
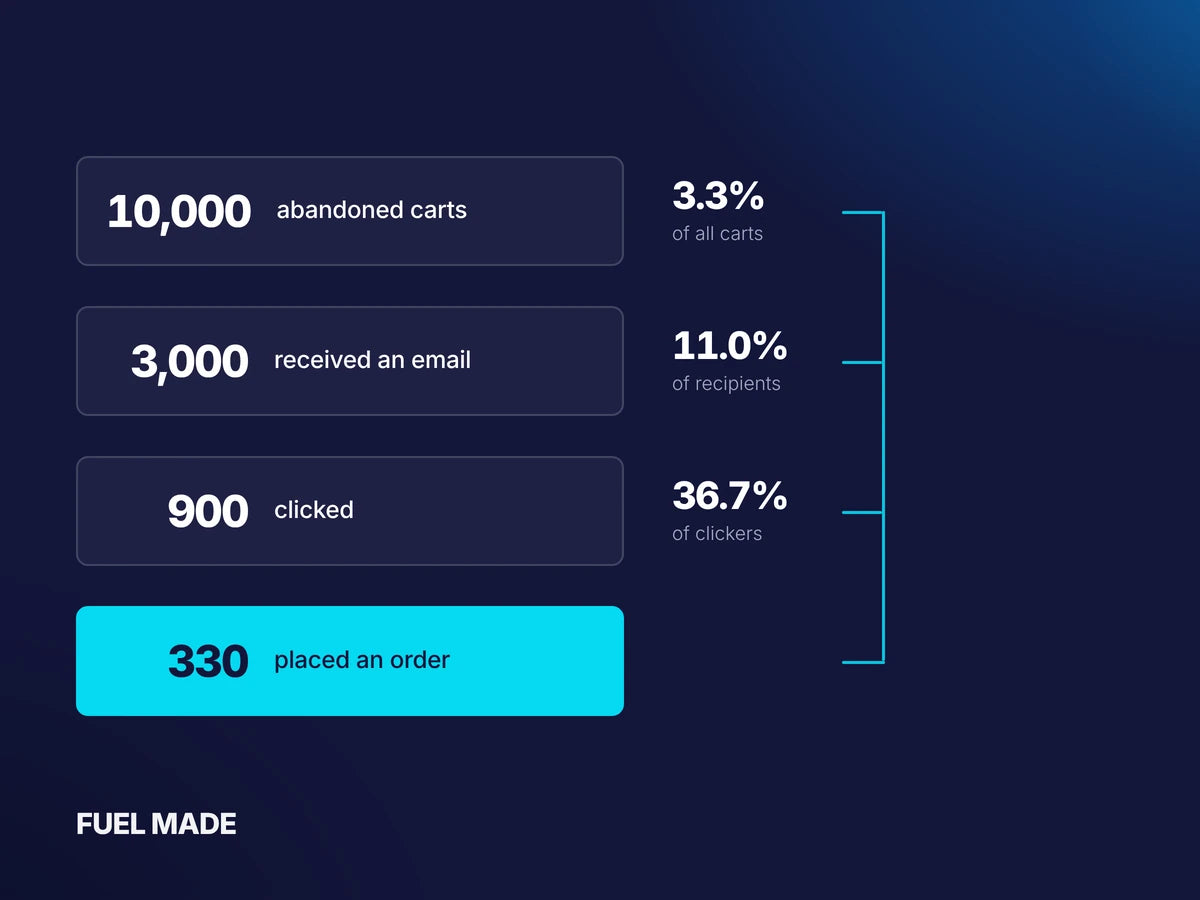
The same abandoned cart flow produces different numbers depending on the denominator. Here's an illustrative example with round figures, not measured data, to show how they end up.
Assume 10,000 shoppers abandon a cart in a month. 3,000 of them are identifiable and receive an email. 900 of them click, and 330 place an order that the reporting model attributes to the flow. For the third row to work as a click-to-purchase rate, we’ll assume all 330 buyers are among the 900 unique clickers.
| Calculation | Arithmetic | Result | What it describes |
|---|---|---|---|
| Orders ÷ recipients | 330 ÷ 3,000 | 11.0% | How the flow performs among people it reached |
| Orders ÷ total abandons | 330 ÷ 10,000 | 3.3% | Share of all abandonment recovered |
| Orders ÷ clickers | 330 ÷ 900 | 36.7% | How well the post-click experience closes |
All three are arithmetically correct. They describe different things, and only the first lines up with how the platform benchmarks are built. The second usually comes from a finance conversation. The third more likely speaks to the landing and checkout experience of the website than the email.
But be mindful of what you’re reporting, as this is where comparisons can go wrong. A brand reporting 36.7% and a brand reporting 3.3% could be running equally good flows.
Attributed orders aren't the same as recovered sales
Attribution credits an order to a flow when it follows an interaction inside the attribution window, but it doesn't establish that the email caused the purchase. Some of those shoppers were coming back regardless, and the flow collected the credit on the way past.
Incremental revenue is the subset that wouldn't have happened without the message. Measuring it takes a controlled holdout, where a randomly selected portion of eligible shoppers is withheld from the flow and the two groups are compared. Klaviyo documents holdout groups for this purpose. Every benchmark figure in this article, and almost certainly every figure you'll compare yourself against, is attributed rather than incremental.
That doesn't make attributed numbers useless. It makes them a measure of what the reporting model credits, which is fine for tracking your own flow over time and risky as a basis for claiming a flow rescued a given amount of revenue.
What Klaviyo's current data shows
Klaviyo's abandoned cart benchmark report, published October 2, 2026 and drawn from more than 110,000 Klaviyo customers, reports revenue per recipient and click rate. These are the most current published reference points for abandoned cart flows.
| Metric | Email average | Email top 10% | SMS average | SMS top 10% |
|---|---|---|---|---|
| Revenue per recipient | $6.77 | $13.70 | $4.48 | $8.69 |
| Click rate | 6.0% | 11.3% | 10.3% | 18.5% |
Revenue per recipient carries more information than a rate does. A rate treats a $30 order and a $600 order as the same event, so a brand with a high conversion rate and a low average order value can look stronger than the revenue supports. Revenue per recipient prices the flow in the terms the business runs on.
An older Klaviyo article, last updated February 2025, reports a 3.33% placed order rate for abandoned cart flows and describes it as the highest of any flow type. Treat that as a dated reference point rather than a current benchmark. Klaviyo's February 2026 benchmarks put the all-flows average placed order rate at 2.11%, with the top 10% at 4.3%, alongside a 32.2% open rate and a 5.58% click rate across all flows.
Abandoned cart leads other flows on revenue per recipient
Abandoned cart earns more per recipient than any other flow type in Klaviyo's October 2026 data.
| Flow | Email RPR, average | Email RPR, top 10% |
|---|---|---|
| Abandoned cart | $6.77 | $13.70 |
| Welcome series | $5.75 | $13.27 |
| Browse abandonment | $2.08 | $4.32 |
| Post-purchase | $1.80 | $2.77 |
| Win-back | $0.82 | $1.60 |
Browse abandonment earns about a third of what abandoned cart does across this population. This makes sense given the difference in intent between adding to a cart and viewing a product, though these are population averages and your own ranking can differ depending on triggers, audiences, and offers.
Compare inside your own industry and price point
When measured by industry, the revenue figures change quite a bit. In Klaviyo's October 2026 data, top-decile email revenue per recipient runs $35.24 for hardware and home improvement, $28.76 for home and garden, $27.48 for automotive, and $24.72 for electronics.
Average email click rates for abandoned cart are closer together: 6.5% for home and garden, 6.4% for hardware and home improvement, 6.3% for electronics, and 5.7% for automotive.
Note that those two sets aren't apples-to-apples, since the revenue figures are top-decile and the click rates are averages. What the data supports is narrower than it first looks: revenue per recipient varies a lot by industry while click rates vary little. It's reasonable to suspect order value explains part of that, but these figures don't isolate it. The practical conclusion is to benchmark against brands in your own category and price range rather than against ecommerce as a whole.
Much of what drives abandonment happens before the email
Baymard Institute puts the average documented cart abandonment rate at 70.22%, calculated across 50 separate studies. Baymard also reports that 42% of US online shoppers say they abandon because they're just browsing or aren't ready to buy. Comparison shopping and saving items for later sit in that group too.
For the remainder, Baymard's breakdown of stated reasons:
| Reason | Share of abandoners |
|---|---|
| High extra costs: shipping, tax, fees | 40% |
| Slow delivery | 20% |
| Didn't trust the site with card details | 19% |
| Site required account creation | 18% |
| Checkout too long or complicated | 17% |
| Website errors or crashes | 17% |
| Unsatisfactory returns policy | 13% |
| Total cost not visible up front | 12% |
Several of these happen at checkout. An email flow can address trust and cost transparency by restating the returns policy or surfacing shipping thresholds. It can't fix a checkout that crashes or a shipping charge revealed on the final step. If your abandonment rate is well above the documented average, a structured site audit is a good place to start.
Five ways to test an underperforming flow
These are some areas to examine when a flow underperforms. These aren't strict rules, but rather hypotheses to test against your own audience, and results vary by brand.
- Three emails carrying one message. If all three are variations on "you left something behind," test giving each a distinct job rather than a distinct subject line.
- No split between first-time and returning shoppers. Test separate paths. Reassurance about returns and shipping tends to suit first-time buyers; scarcity suits returning customers only when the scarcity is real.
- A product grid where social proof could go. Test replacing recommendations with reviews relevant to the cart contents. Which performs better depends on the catalog and the buying decision.
- A call to action describing navigation. Test "Complete My Order" against "Return to Cart." This is a hypothesis worth testing, not a settled winner.
- A discount in the first email. Leading with one can condition shoppers to wait for offers and gives margin away on buyers who were returning anyway. Test reassurance first and introduce any discount later in the sequence.
When we rewrote FCTRY's abandoned cart flow around the brand's own voice instead of a generic template, abandoned cart conversions rose 15%. FCTRY sells satirical political action figures, and the flow had been written as though it sold anything else.
Before testing copy, confirm the technical layer is sound. Tracking, deliverability, trigger conditions, and exclusion rules all cap what the copy can do. These changes take strategy, copywriting, and implementation time, so they're not free, but they rarely require new software.
How to pull a number you can compare
A manually calculated figure is only comparable to a benchmark built the same way, so match the published methodology rather than assuming your number lines up.
- Use Klaviyo's own benchmark reporting where it exists, matching flow type, channel, and metric. That removes most methodology mismatch.
- If calculating by hand, set a date range that's closed out, allowing your account's configured attribution window to mature. Attribution windows are configurable, so check yours rather than assuming a default.
- Decide your reporting scope before you divide, and say which it is. Klaviyo reports both message-level placed order rate and flow-level conversion rate using unique recipients. Both are valid and they answer different questions.
- Keep the scope consistent on both sides of the comparison. A person who receives three messages legitimately appears in three message-level denominators and once in a unique-recipient flow measure.
- Record revenue per recipient alongside any rate, since rates hide order value.
- Compare against your own vertical and against your own flow over time, which is the comparison least affected by methodology differences.
Frequently asked questions
What is a good abandoned cart recovery rate?
There's no single answer, because "recovery rate" describes several different calculations. The current published reference points are from Klaviyo's October 2026 report: abandoned cart email flows average $6.77 revenue per recipient and a 6.0% click rate, with the top 10% at $13.70 and 11.3%. What counts as good for you depends on your metric, audience, flow setup, and attribution settings.
How is placed order rate different from conversion rate?
In Klaviyo they can describe the same measure. Klaviyo defines email conversion rate as the share of recipients who place an order after interacting with the message, and when the selected conversion event is Placed Order, that's the same idea as placed order rate. The meaningful contrast is between a recipient-based rate like these and a click-to-purchase rate, which divides by clickers instead and produces a larger number.
What percentage of abandoned carts can you realistically recover?
It depends heavily on how many abandoners you can identify and contact, which varies by traffic mix, pop-up performance, and how early your flow triggers. Measured against every abandoned cart rather than every recipient, the figure is necessarily smaller than a recipient-based rate. Baymard Institute puts average documented cart abandonment at 70.22% across 50 studies.
Why is my abandoned cart recovery rate so different from the benchmark?
Check the denominator first. A rate calculated over clickers will be much larger than one calculated over recipients, and one calculated over all abandoned carts will be smaller than both. Then check the attribution window and whether you're comparing the same channel and flow type. Methodology differences explain most surprising gaps before performance does.
Does SMS recover more carts than email?
In Klaviyo's October 2026 data, SMS abandoned cart flows show a higher click rate than email, at 10.3% against 6.0%, while email shows higher revenue per recipient, at $6.77 against $4.48. These are separate population averages rather than a controlled comparison, so they don't establish which channel performs better for a given brand, or what happens when both run together.
How many emails should an abandoned cart flow have?
Three is the common structure. The count matters less than whether each message does something different, but the published benchmarks don't establish an optimal number, and the right answer depends on your audience and purchase cycle. Test sequence length rather than adopting a number.
Should abandoned cart emails include a discount?
Testing reassurance before discounting is a reasonable default, since an immediate discount can condition shoppers to abandon deliberately and gives margin away on buyers who were returning anyway. That's not an argument that a first-message discount never works. Baymard's data shows 19% of abandoners cite distrust and 13% cite returns policy, neither of which a discount addresses.
Fuel Made is a Klaviyo Master Elite Partner working with Shopify and Shopify Plus brands on email and SMS programs, CRO, and custom Shopify design and development. If you'd like to talk through your abandoned cart flow, book a call with our team.